Ask your homelab what's wrong
Type "why is pve-storage slow?" and get a plain-English answer. 8MB Go agent, open source, 5-minute setup.
curl -fsSL https://labwatch.zazastation.duckdns.org/install.sh | sudo bash
copy
Or download the binary directly from amd64 / arm64. Open source — AGPL-3.0 server, MIT agent. Source on GitHub. (review the script first)
See your lab at a glance
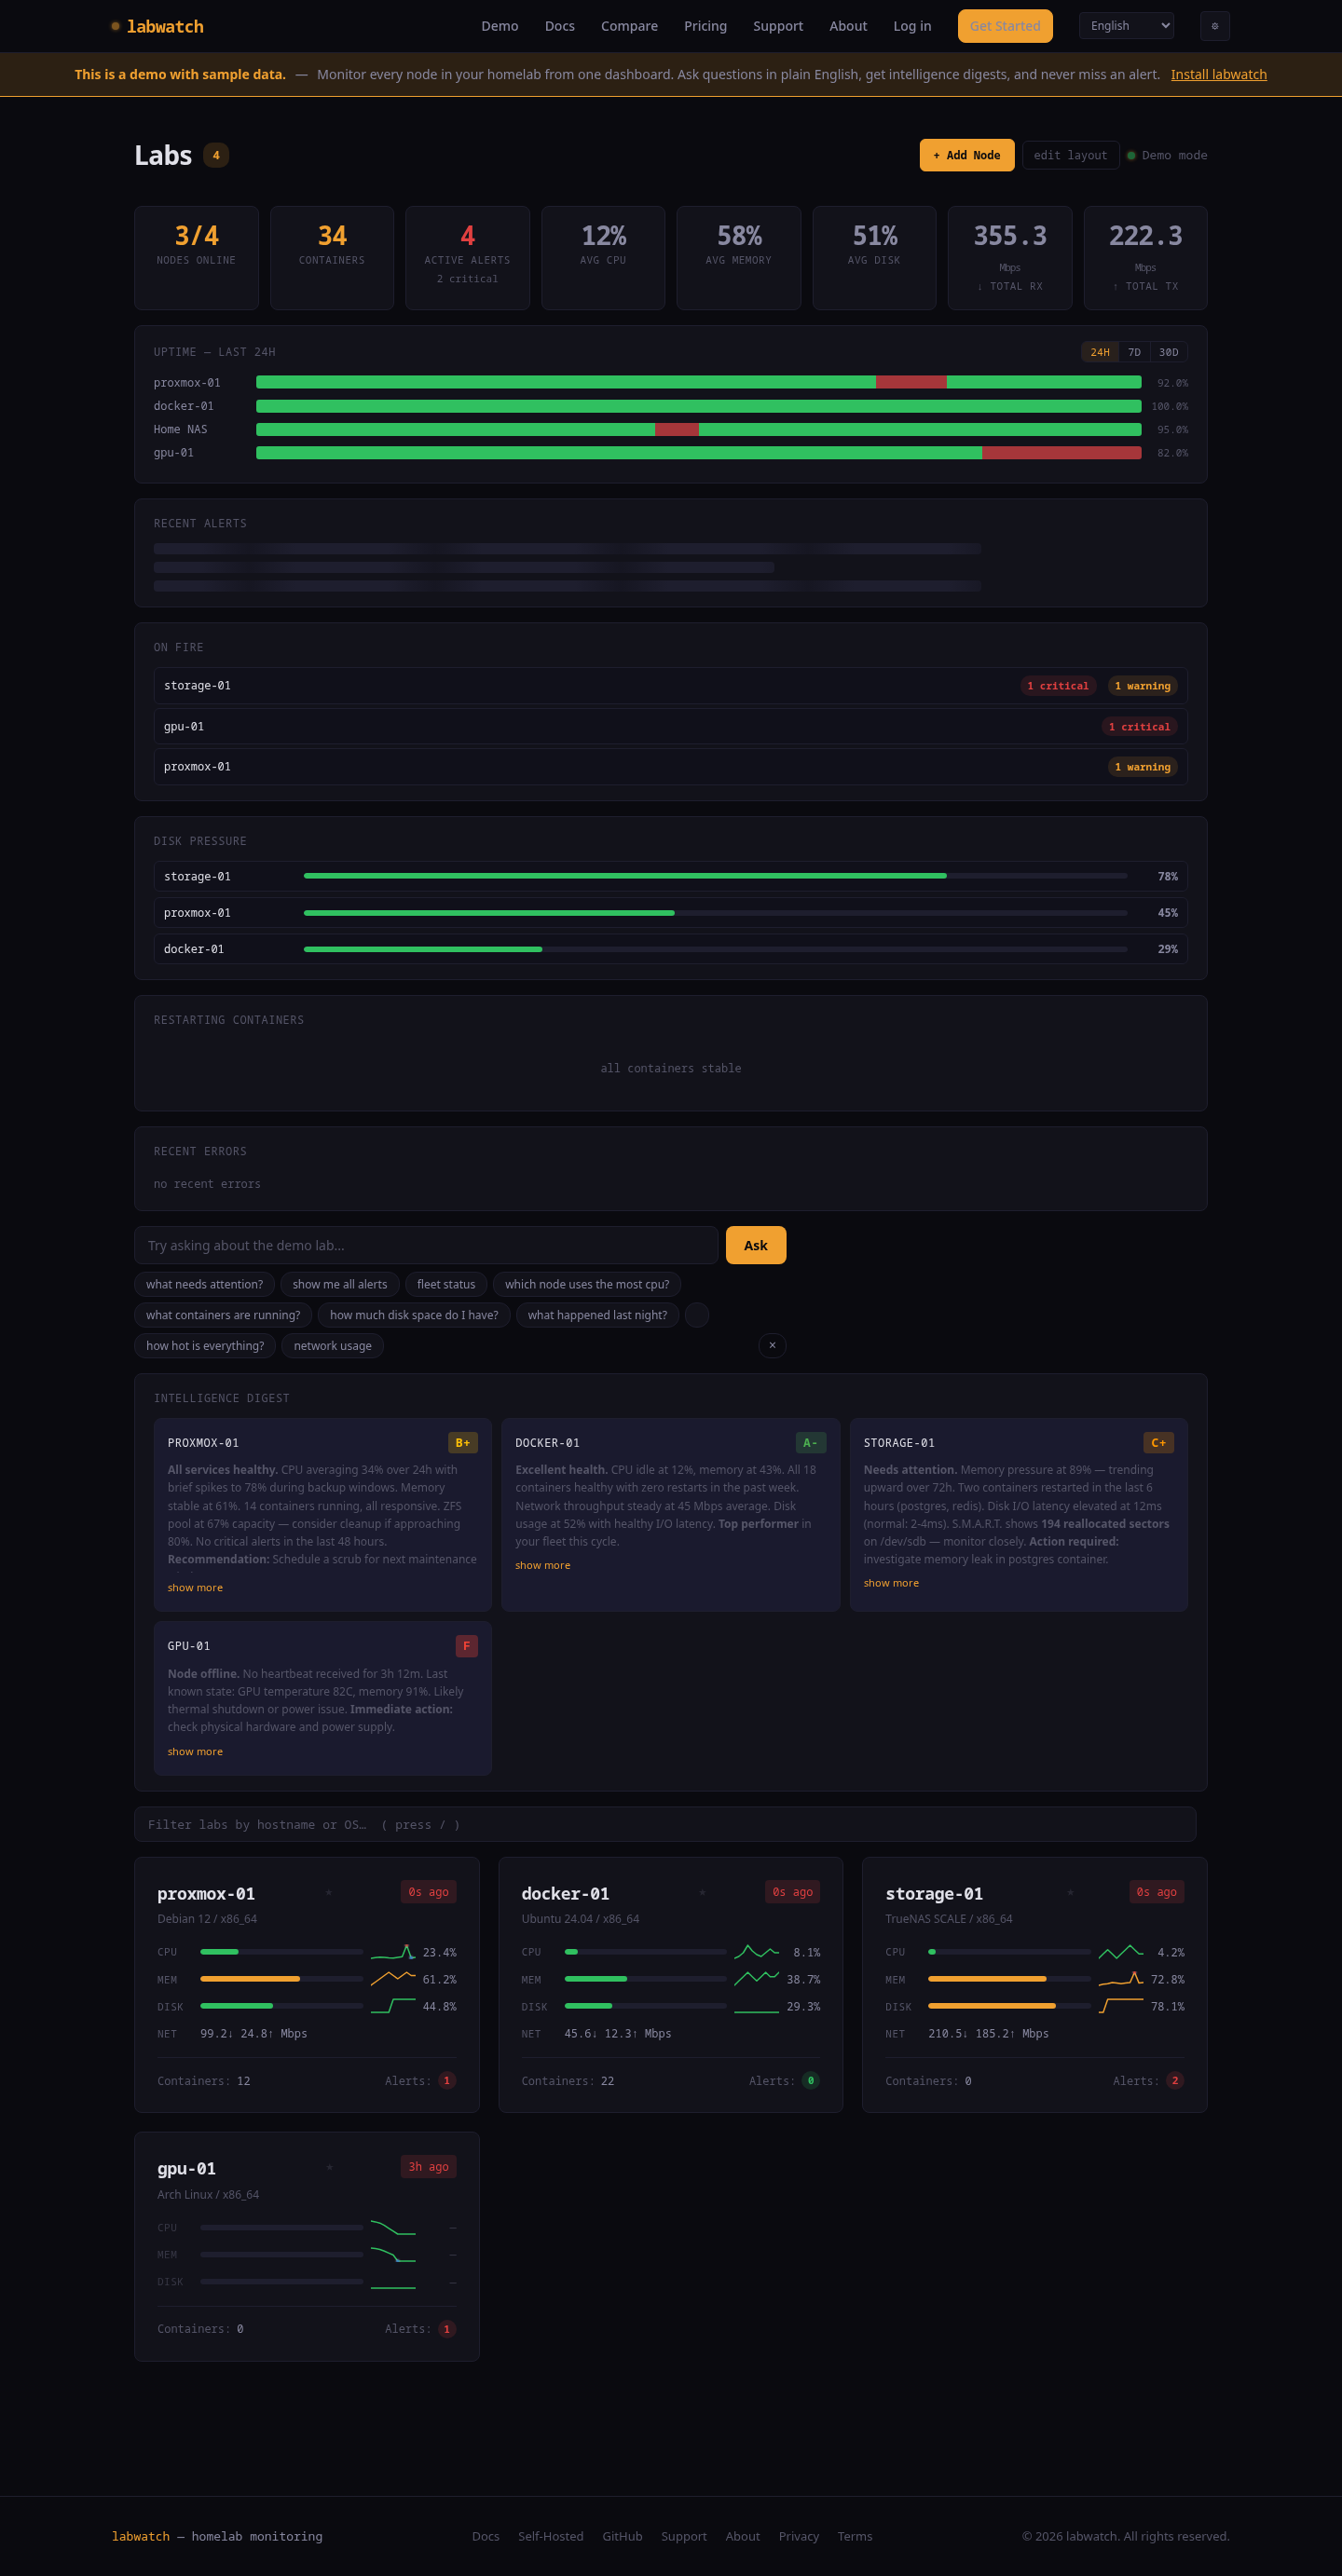
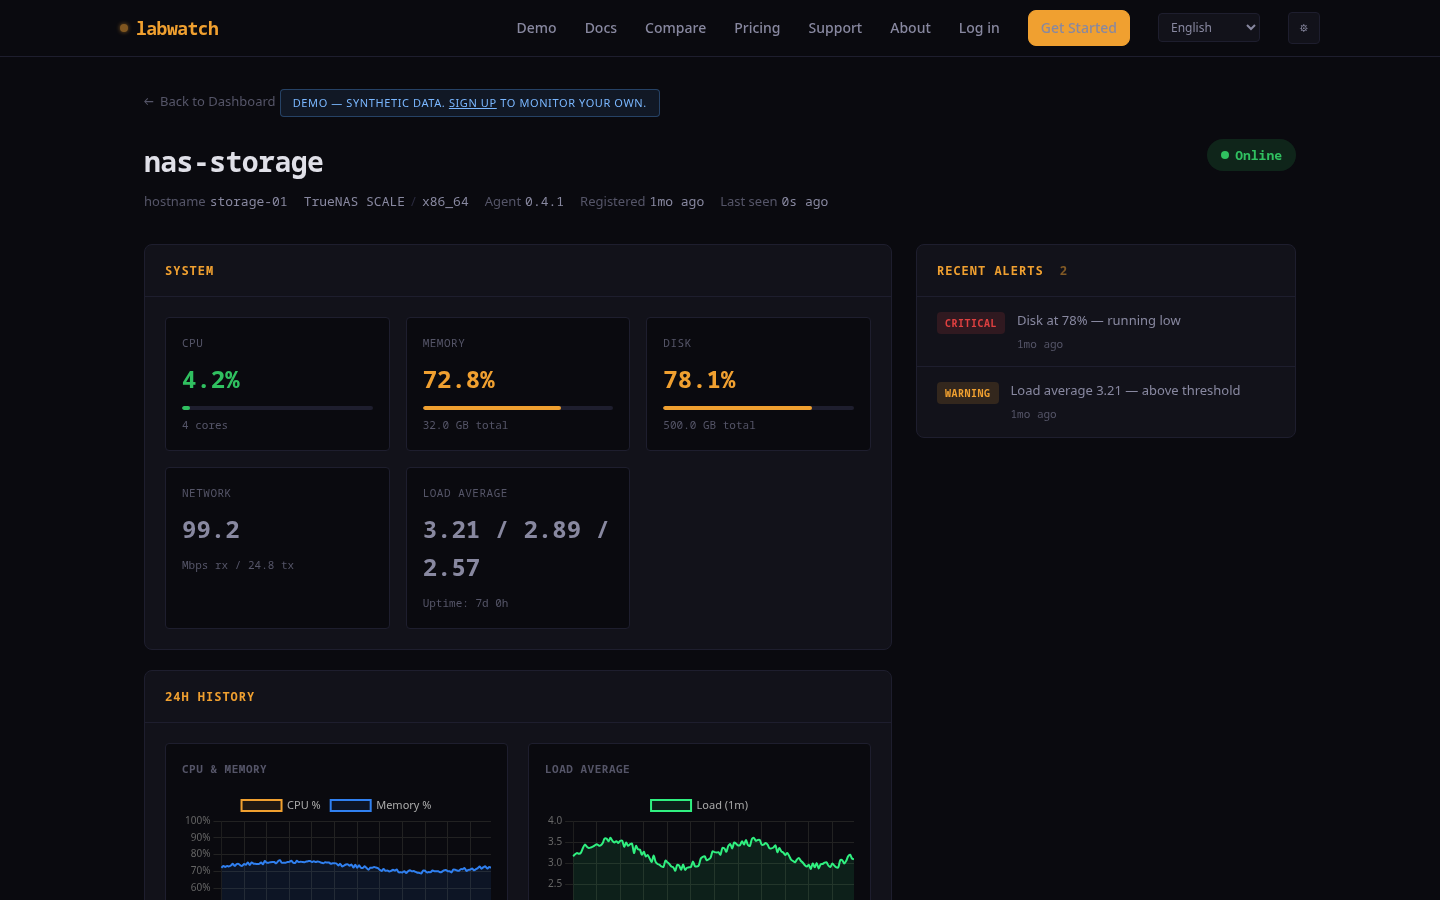
Fleet overview (left) and node detail (right) — real data from a 5-node Proxmox cluster.
Three steps. Five minutes.
From zero to full homelab intelligence in one terminal session.
Install the agent
One command installs a lightweight agent on each node. No inbound ports to open, under 50MB RAM at runtime.
Metrics flow automatically
CPU, memory, disk, network, Docker containers, services. Outbound only — your firewall stays closed.
Ask questions, get answers
Type questions in plain English. Get smart alerts, metric diagnostics, and daily intelligence digests with per-node grades.
Not just graphs. Intelligence.
labwatch understands your homelab, not just its metrics.
Natural Language Queries
Type "why is pve-storage slow?" and get a diagnostic answer. Not a graph — an explanation with metric context.
NO LLM — pure regex + rulesSmart Alerts
Deduplication, auto-resolution, and threshold monitoring. Catches slow disk fills and resource pressure before they become outages.
Fleet Intelligence
Daily plain-English digest of your entire lab. Per-node letter grades, trends, anomalies, and actionable recommendations.
Docker Monitoring
Container health, restart loop detection, CPU and memory per container. Sees inside your stacks, not just the host.
Works With Your Stack
Runs alongside Grafana, Uptime Kuma, Prometheus. labwatch adds the intelligence layer they don't have.
Open Source, Your Control
MIT-licensed Go agent you can audit. Outbound-only connections. Self-host the server or use our hosted version. Your data stays yours.
Compared to Beszel, Uptime Kuma & Netdata
Honest feature matrix. Everyone's open source. Each tool is good at something different.
Beszel wins on pure minimalism. Netdata wins on feature breadth. Kuma wins on uptime focus. labwatch wins when you want plain-English answers from your own metrics — no LLM, no cloud.
| Feature | labwatch | Beszel | Uptime Kuma | Netdata |
|---|---|---|---|---|
| Natural-language queries ("why is pve slow?") | ✓ | ✕ | ✕ | cloud only |
| Multi-host agents | ✓ | ✓ | indirect | ✓ |
| Per-user dashboard layout (drag, pin, reorder) | ✓ | ✕ | basic | basic |
| 24h heartbeat bar | ✓ | ✕ | ✓ | ✕ |
| Anomaly dots on sparklines | ✓ | ✕ | ✕ | ✓ |
| One-command install | ✓ | ✓ | ✕ | ✓ |
| Click-to-test notifications | ✓ | ✕ | ✓ | ✕ |
| Agent RAM (typical steady-state) | ~20 MB | ~15 MB | (server only) | ~150 MB |
| Install complexity | 1 command | 1 command | docker | 1 command |
| Docker container stats | ✓ | ✓ | ✕ | ✓ |
| GPU + temperature | ✓ | ✓ | ✕ | ✓ |
| S.M.A.R.T. disk health (temp, reallocated sectors, pass/fail) | ✓ | ✓ | ✕ | ✓ |
| ZFS pool health (capacity, scrub status, errors) | ✓ | partial | ✕ | ✓ |
| Disk I/O metrics (read/write throughput, IOPS) | ✓ | ✓ | ✕ | ✓ |
| Centralized log collection (journald + Docker, searchable) | ✓ | ✕ | ✕ | Loki needed |
| Notification channels (integrations) | ntfy, Discord, Slack, Telegram + Apprise | Shoutrrr (~20) | 90+ | ~15 |
| Prometheus / Grafana export (/metrics endpoint) | ✓ | ✓ | ✕ | ✓ |
| HTTP / TCP uptime checks (external probe) | local | ✕ | ✓ | ✕ |
| Metric collectors / plugins | built-in | built-in | N/A | 800+ |
| Open source | ✓ | ✓ | ✓ | ✓ |
See it in action
Real queries, real answers. No graphs to interpret.
No LLM, no API keys, no data leaves your server. 100% rule-based engine.
Simple, honest pricing
Start free. Scale when you need to.
- + 3 nodes
- + 30-day retention
- + Smart alerts + notifications
- + Natural language queries
- + Intelligence digest
- + Unlimited nodes
- + 1 year retention
- + Everything in Free
- + Priority support
- + We host it for you
- + Unlimited nodes
- + Custom integrations
- + SLA & priority support
- + Self-hosted option
- + Dedicated onboarding